EDI Dashboard
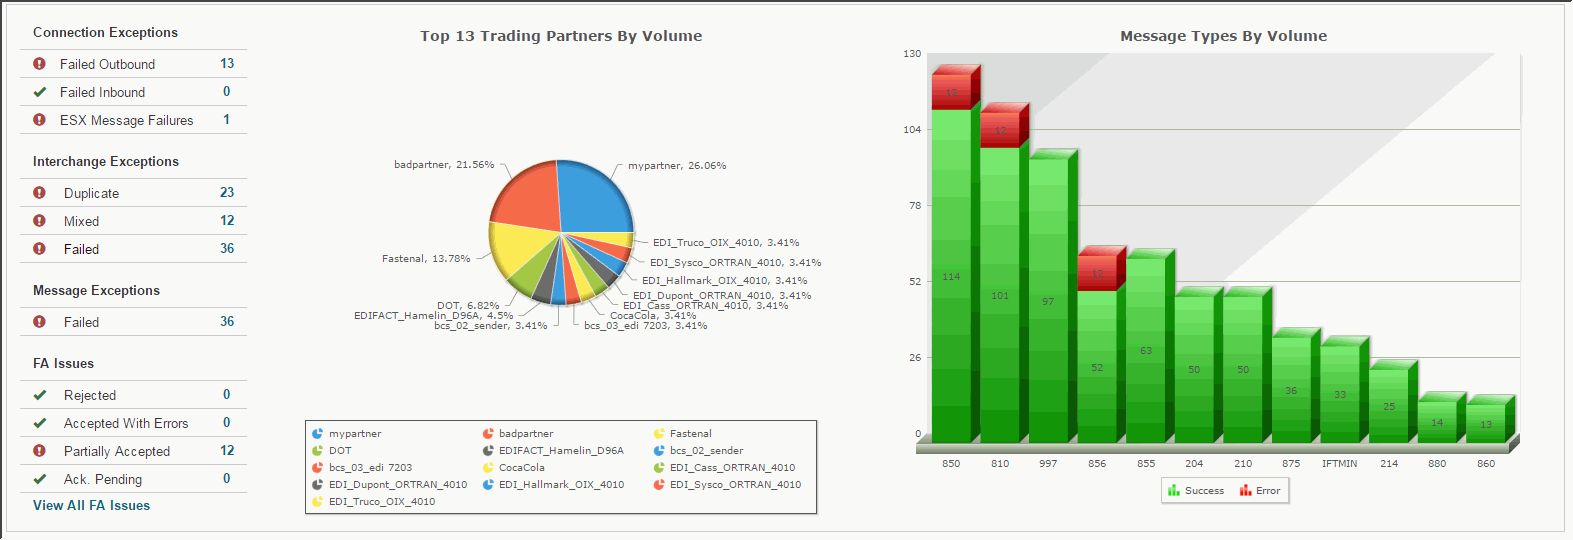
The interactive EDI Dashboard report gives you an intuitive access point to your current Trading Partners/Endpoints, exceptions, message volume, issues, and other important data – all based within a specified period of time. This report serves as the primary tool to view, manage, sort and export other reports.

Define Selection Criteria before running report
- Start and End Dates
- Number of Days
- Maximum number of Endpoints, displayed in a pie chart (Clarify uses trading
partners).Note: Each time you log in, the Dashboard resets your options to display the default 10 Endpoints over the previous 24-hour period
Report Sections
- Exceptions (Connection, Interchange, Message, and FA issues)
- Top Endpoints (or Trading Parters) by Volume
- Message Types by Volume
Exceptions (Connection, Interchange, Message, FA)
- Connection: Failed Outbound, Failed Inbound, and ESX Message Failures.
- Interchange: Duplicate, Mixed, and Failed.
- Message: Failed.
- FA: Accepted with Errors, Partially Accepted, Acknowledgement Pending, and View All FA Issues.
View All FA Issues
The FA Issues section displays a list of FA statuses over a configurable period of time*. Clicking on a specific error message type launches the Group Report, which displays a list of Groups containing the error status specified. This section also provides a report of all FA error types.
Trading Partners by Volume
- While the default setting displays your top 10 Trading Partners over the previous 24-hour period, these numbers can be adjusted.
- Click on a specific pie slice to launch related Trading Partner details report.
- The interactive legend sorts Trading Partners in descending order of the volume of transactions from left to right, top to bottom.
- Other options include rotating the chart.
Message Type by Volume
- Click on sections of each bar to launch the related Message report (displaying all Message transactions for the selected message type and status).
- The chart displays successful and the unsuccessful (error) counts.
- Click the Success and Error sections of the graph to view or hide results.
*The dates used reflect the interchange date and time.